Blog | ArchiTeam 2018 member survey – part 2
![]()
![]()
This article was written on behalf of ArchiTeam, Australia’s leading representative of small, medium and emerging architects, in my role as director.
Between late September and early October last year, ArchiTeam conducted a substantial survey of our members. Though we’ve conducted member surveys in the past and gather membership data in the insurance forms you fill out each renewal period, this was the first time that we’ve ever looked so deeply into the work and lives of the people who make ArchiTeam the great organisation it is.
We divided the survey into four parts and asked:
- Who are you?
- What are you working on?
- What do you think of the future?
- What do you think of ArchiTeam?
I shared the results to the first part last month, an archive of which you can access here. Read on below for the second of a series of articles where I share with you the insights we’ve gained.
What are you working on?
This is a gritty section of the ArchiTeam membership survey, examining the types, number and construction budgets of your projects, as well as your fee methods and income strategies. It paints a vivid picture of the work you do and how you charge for it.
It’s a field of enquiry particularly close to my data-loving heart, as it looks at both the money you earn in your livelihoods as architects and the financial contribution your work makes to the Australian economy.[1]
First, let’s take a look at your projects:
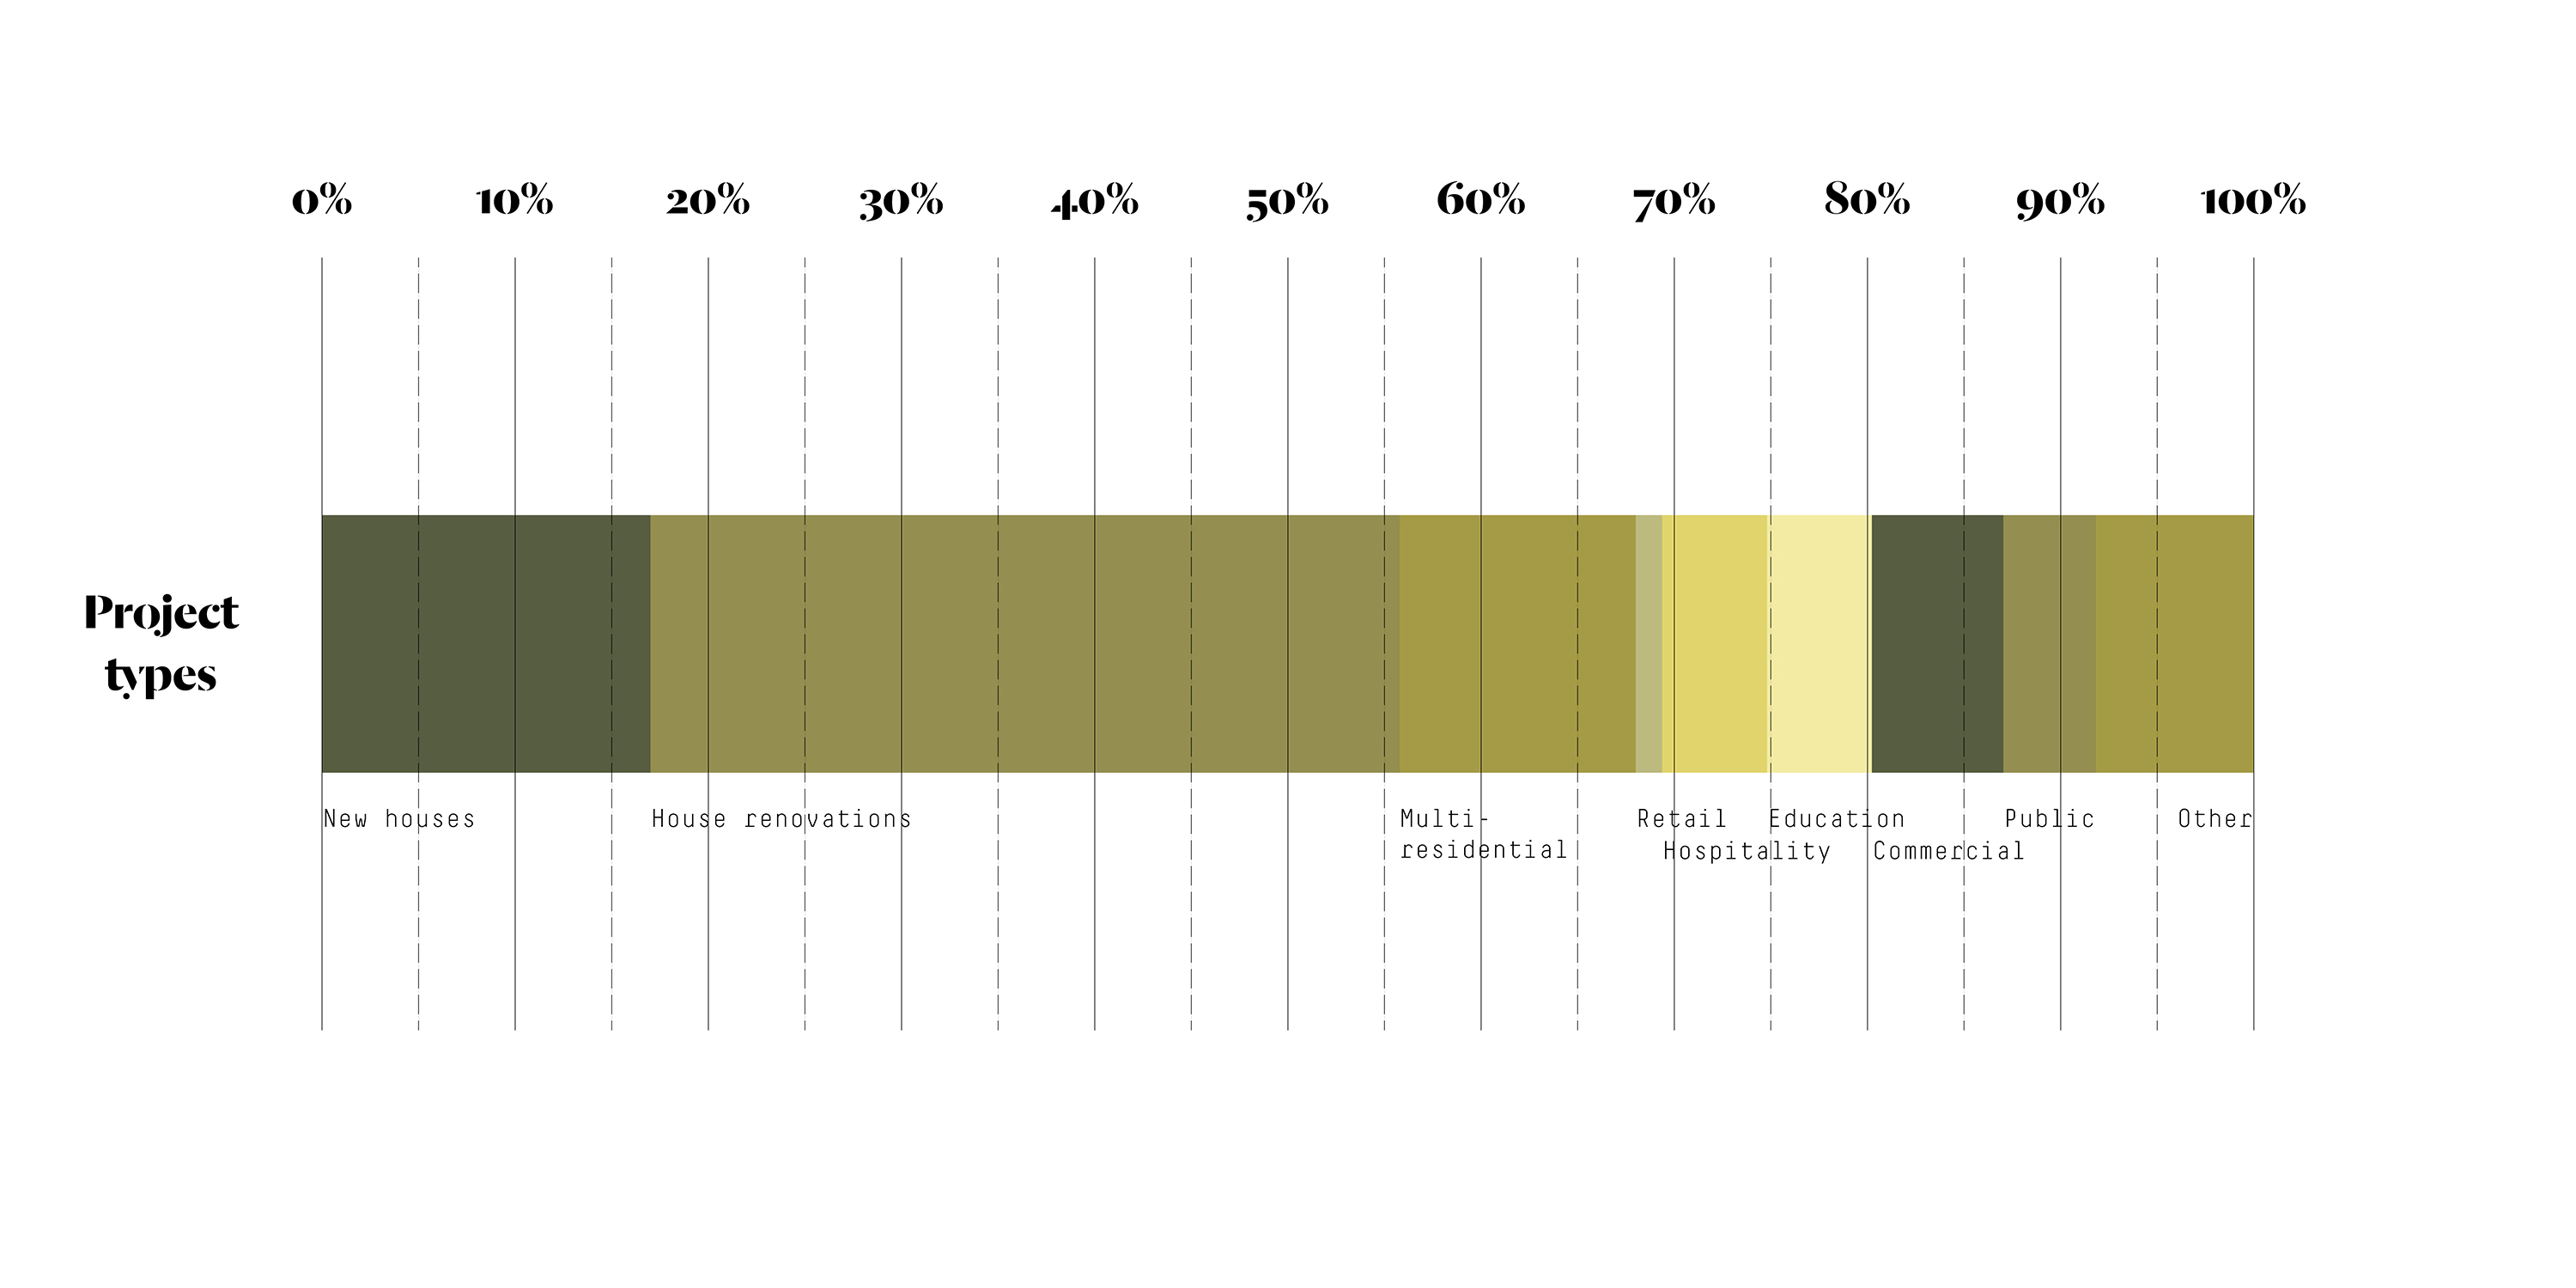
What does this tell us?
- New houses and house renovations together represent over half (56%) of your projects.
- Add in townhouses and apartments, and the residential sector represents 68% of the work you do.
Given the predominance of small practices within the ArchiTeam membership, these results are perhaps to be expected, as are the volume and budgets of your projects:
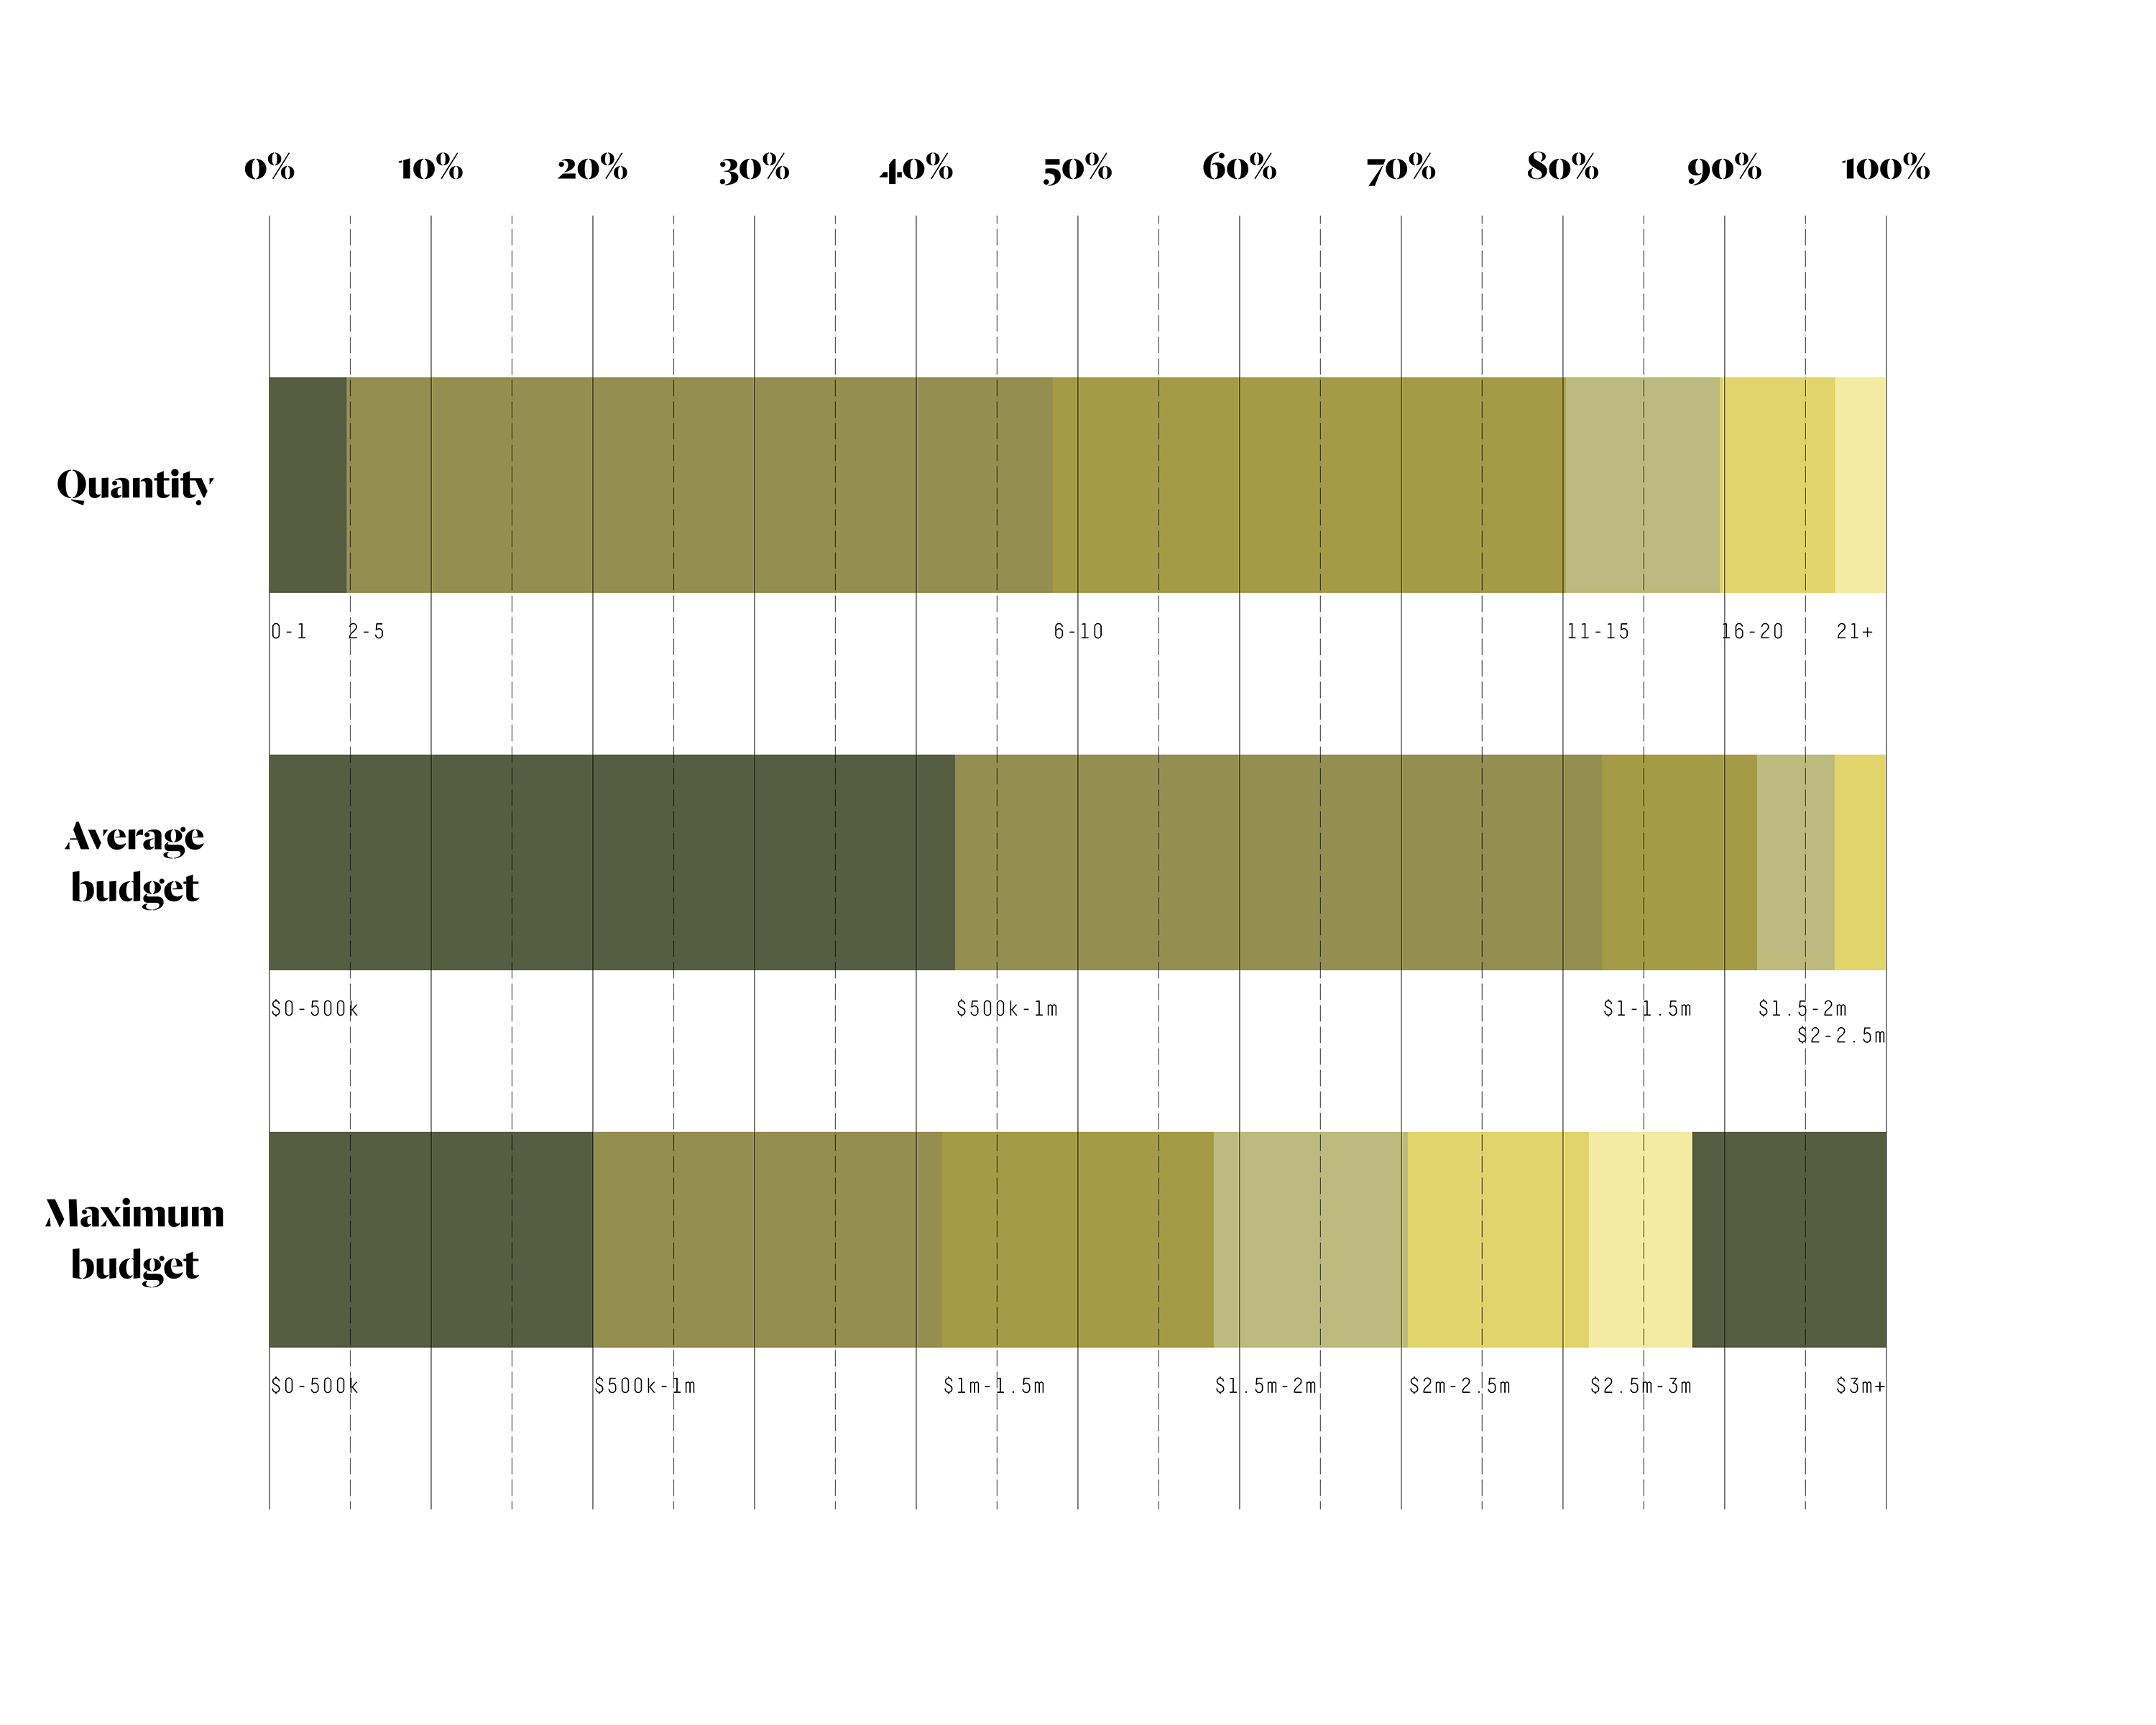
What does this tell us?
- On average, you are each currently working on 7.5 projects.
- 80% of you are currently working on 10 projects or fewer.
- The average budget of your projects is $680,000.
- 82% of your projects have an average budget of less than $1,000,000.
- The average maximum budget of your projects is $1,440,000.
- Maximum budgets are more diverse than the other two measures, with a reasonably even split across the full surveyed range.
But there is more to this data than meets eye.
If on average you (and the architecture practices you run) are working on seven and a half $680,000 projects, you are each working on $5,100,000 worth of construction activity. By extrapolation, this means that ArchiTeam’s 585 member practices are together working on around $3,000,000,000 worth of construction activity.[2]
That’s right, you heard me. Three BILLION dollars of construction.
If you’ll bear with me, I’d like to dwell on this for a moment from another angle:
- The Australian gross domestic product is around $1.8 trillion.[3]
- The Australian population is 25.4 million.[4]
- Which means the average GDP per Australian is a touch over $70,000.
But the average GDP per ArchiTeam member is $5,100,000. Which means the product of your labour contributes 72 times more to the Australian economy than the average Australian. This is not of course even close to a rigorous analysis, but it serves as a useful reminder that there are many ways to measure the success of the architecture profession.
Okay, let’s move on to fee setting and revenue:
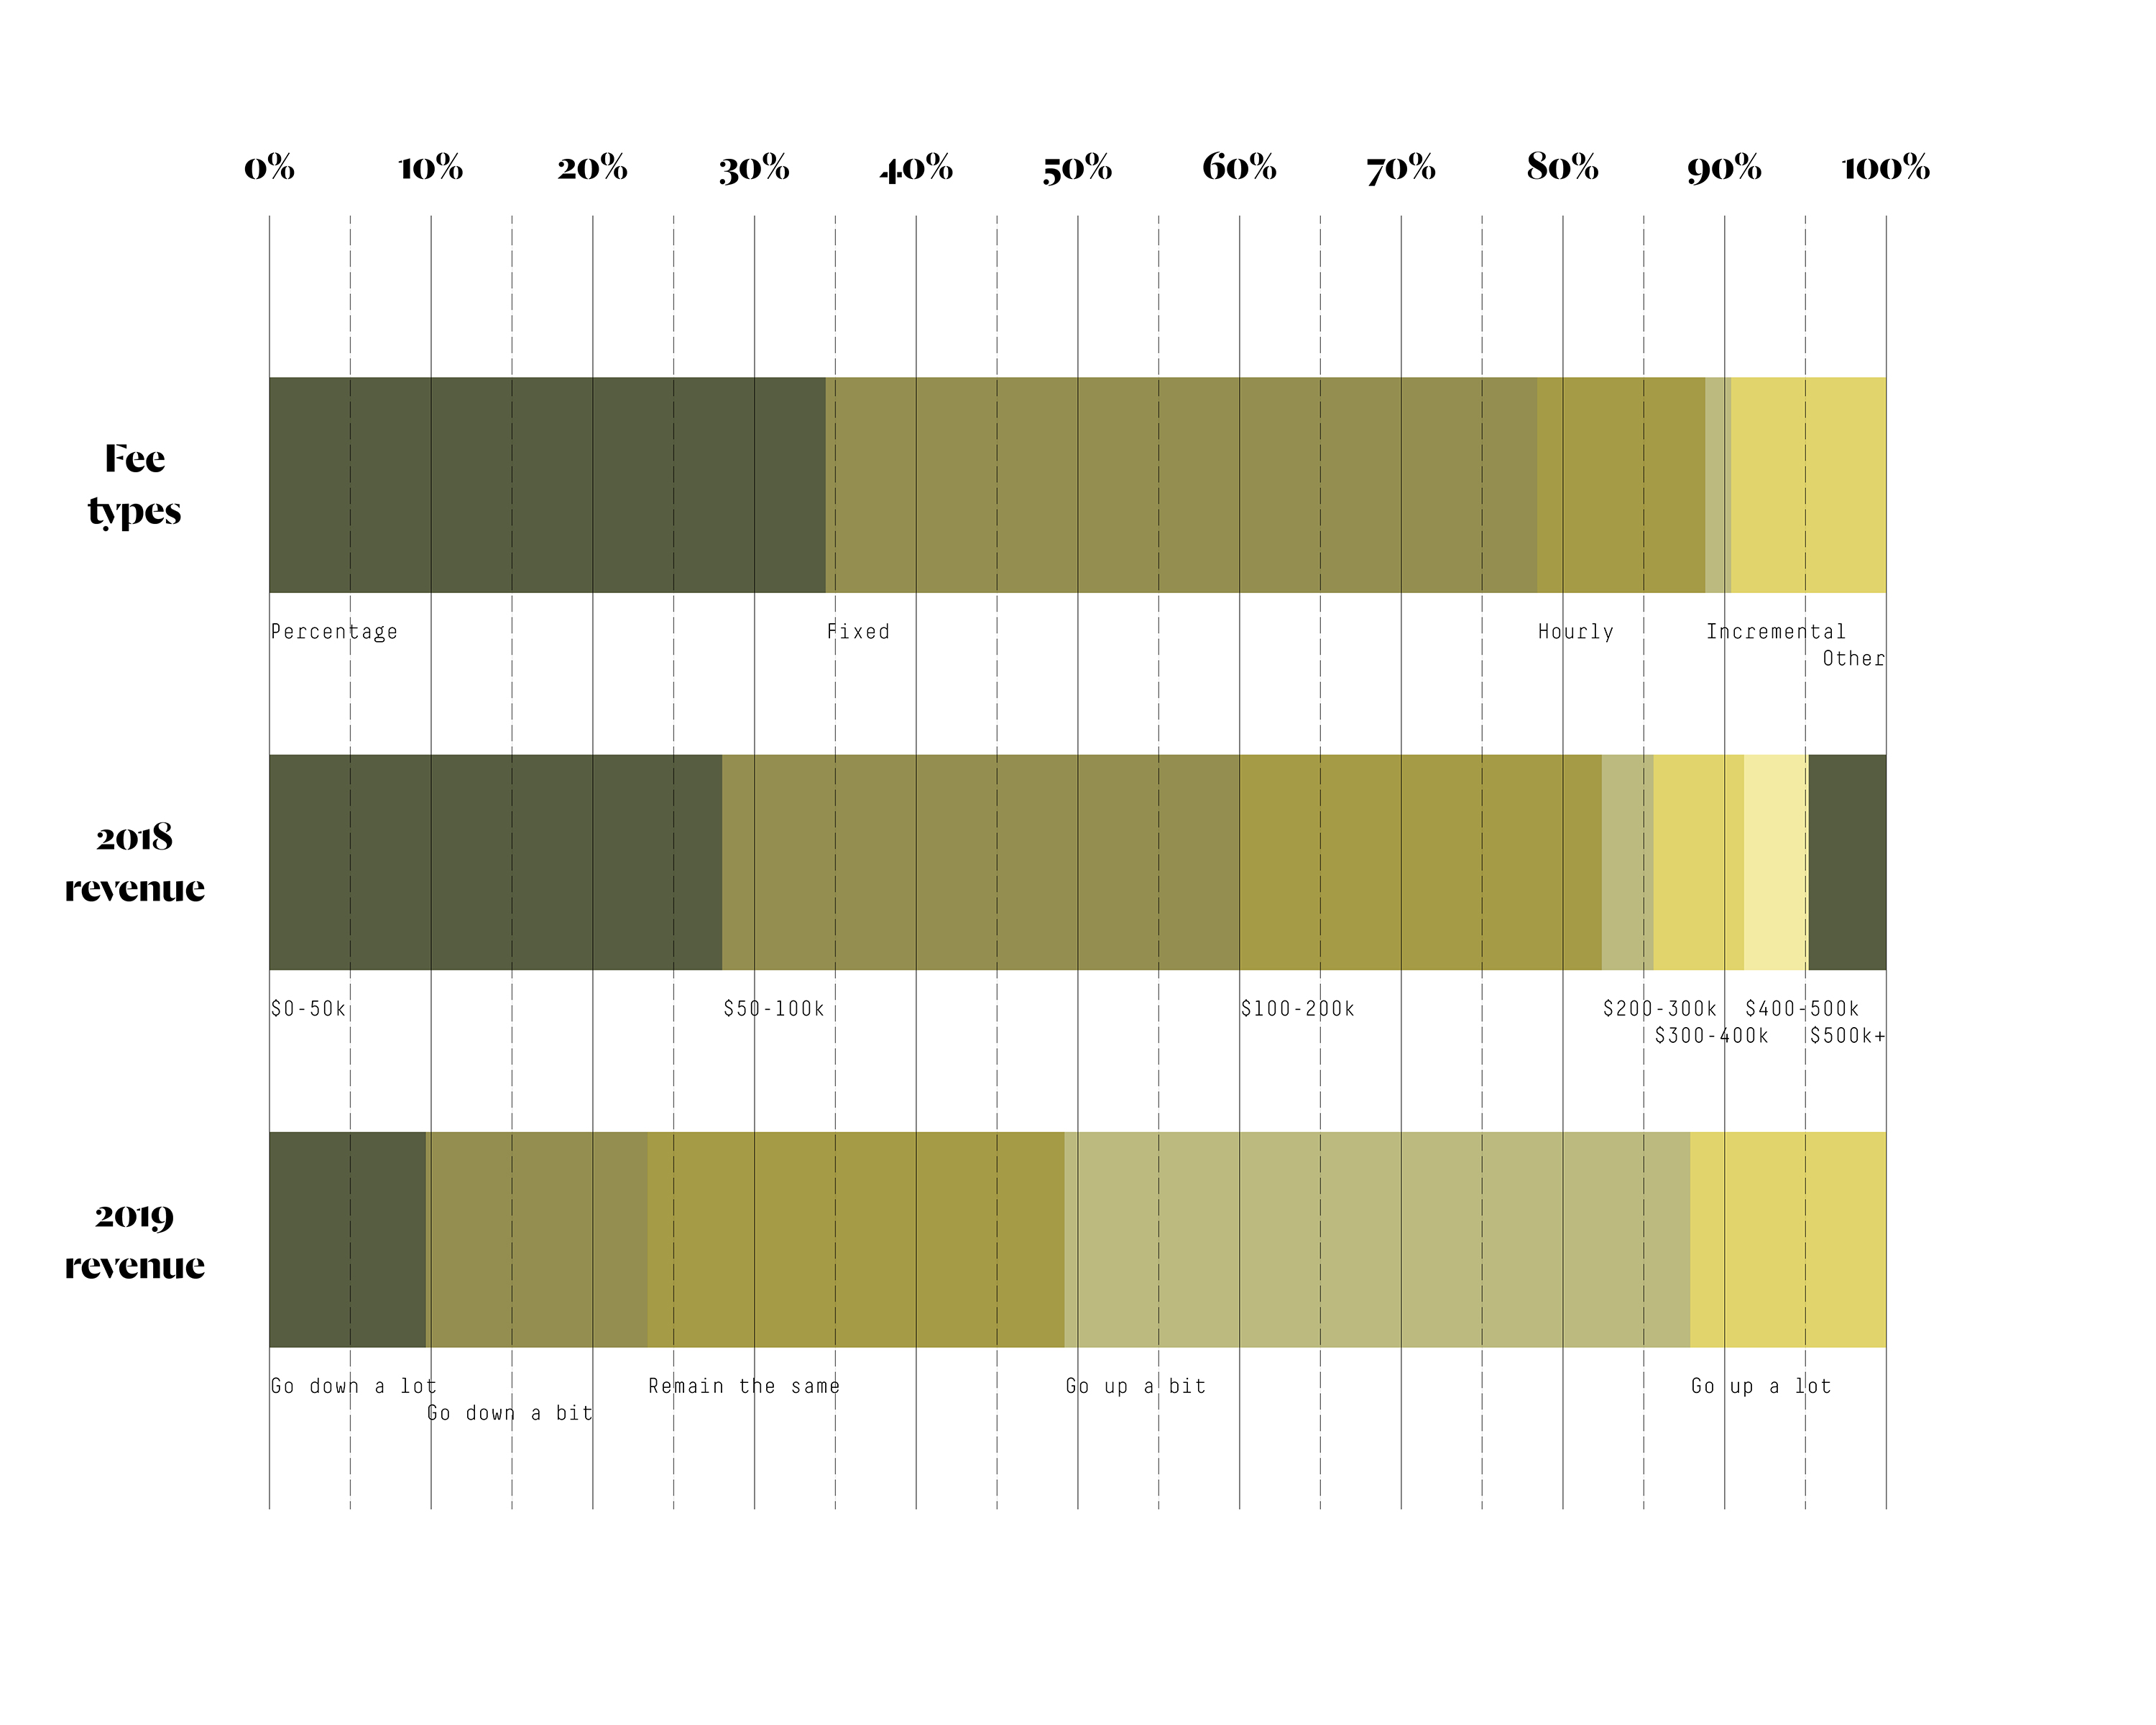
What does this tell us?
- 78% of you prefer percentage and fixed fee types.
- 82% of you receive gross revenue of less than $200,000.[5]
- At the time of the survey, your outlook for the financial year just concluded was predominantly either neutral or cautiously positive, together representing 65% of you.
As with project types (68% residential), project quantities (80% fewer than 10) and budgets (82% less than $1,000,000), these fee and income measures reveal a strong homogeneity within the ArchiTeam membership. In other words, most of you work within a similar construction sector, on a similar number of projects, with similar budgets. And most of you charge fees in similar ways and earn similar revenue.
There’s a weakness to this homogeneity, as revealed by the widely spread, negative impact of the current downturn in residential construction. But there’s also a strength. ArchiTeam members are all in the same boat together, facing similar business and practice challenges, and able to provide robust peer support to one another.
To provide some additional granularity to the revenue data above, let’s look at how revenue relates to practice size:
Before I analyse this infograph, I must confess that the data it represents isn’t actually that crash hot. The member survey only asked how many people are in your teams, not how many days per week they each work. Consequently, the revenue to team size ratio is distorted.[6] Nevertheless, I wanted to include the infograph in this article because it’s an excellent way to examine revenue per person. So with that in mind, what does it tell us?
- Predictably, gross income is proportional to team size.
- But below 10 people, a bigger team is not as rewarding as you might hope. A team of 8 is 300% larger than a team of 2, but on average only sees a 125% increase in revenue.
- Above 10 people, revenue is much rosier. A team of 14 is 100% larger than a team of 7, and on average sees a 551% increase in revenue.
Finally, let’s look at the full service fees you charge on a typical project. To keep your responses as comparable as possible, we asked you to provide this information for a $1,000,000 new house design:
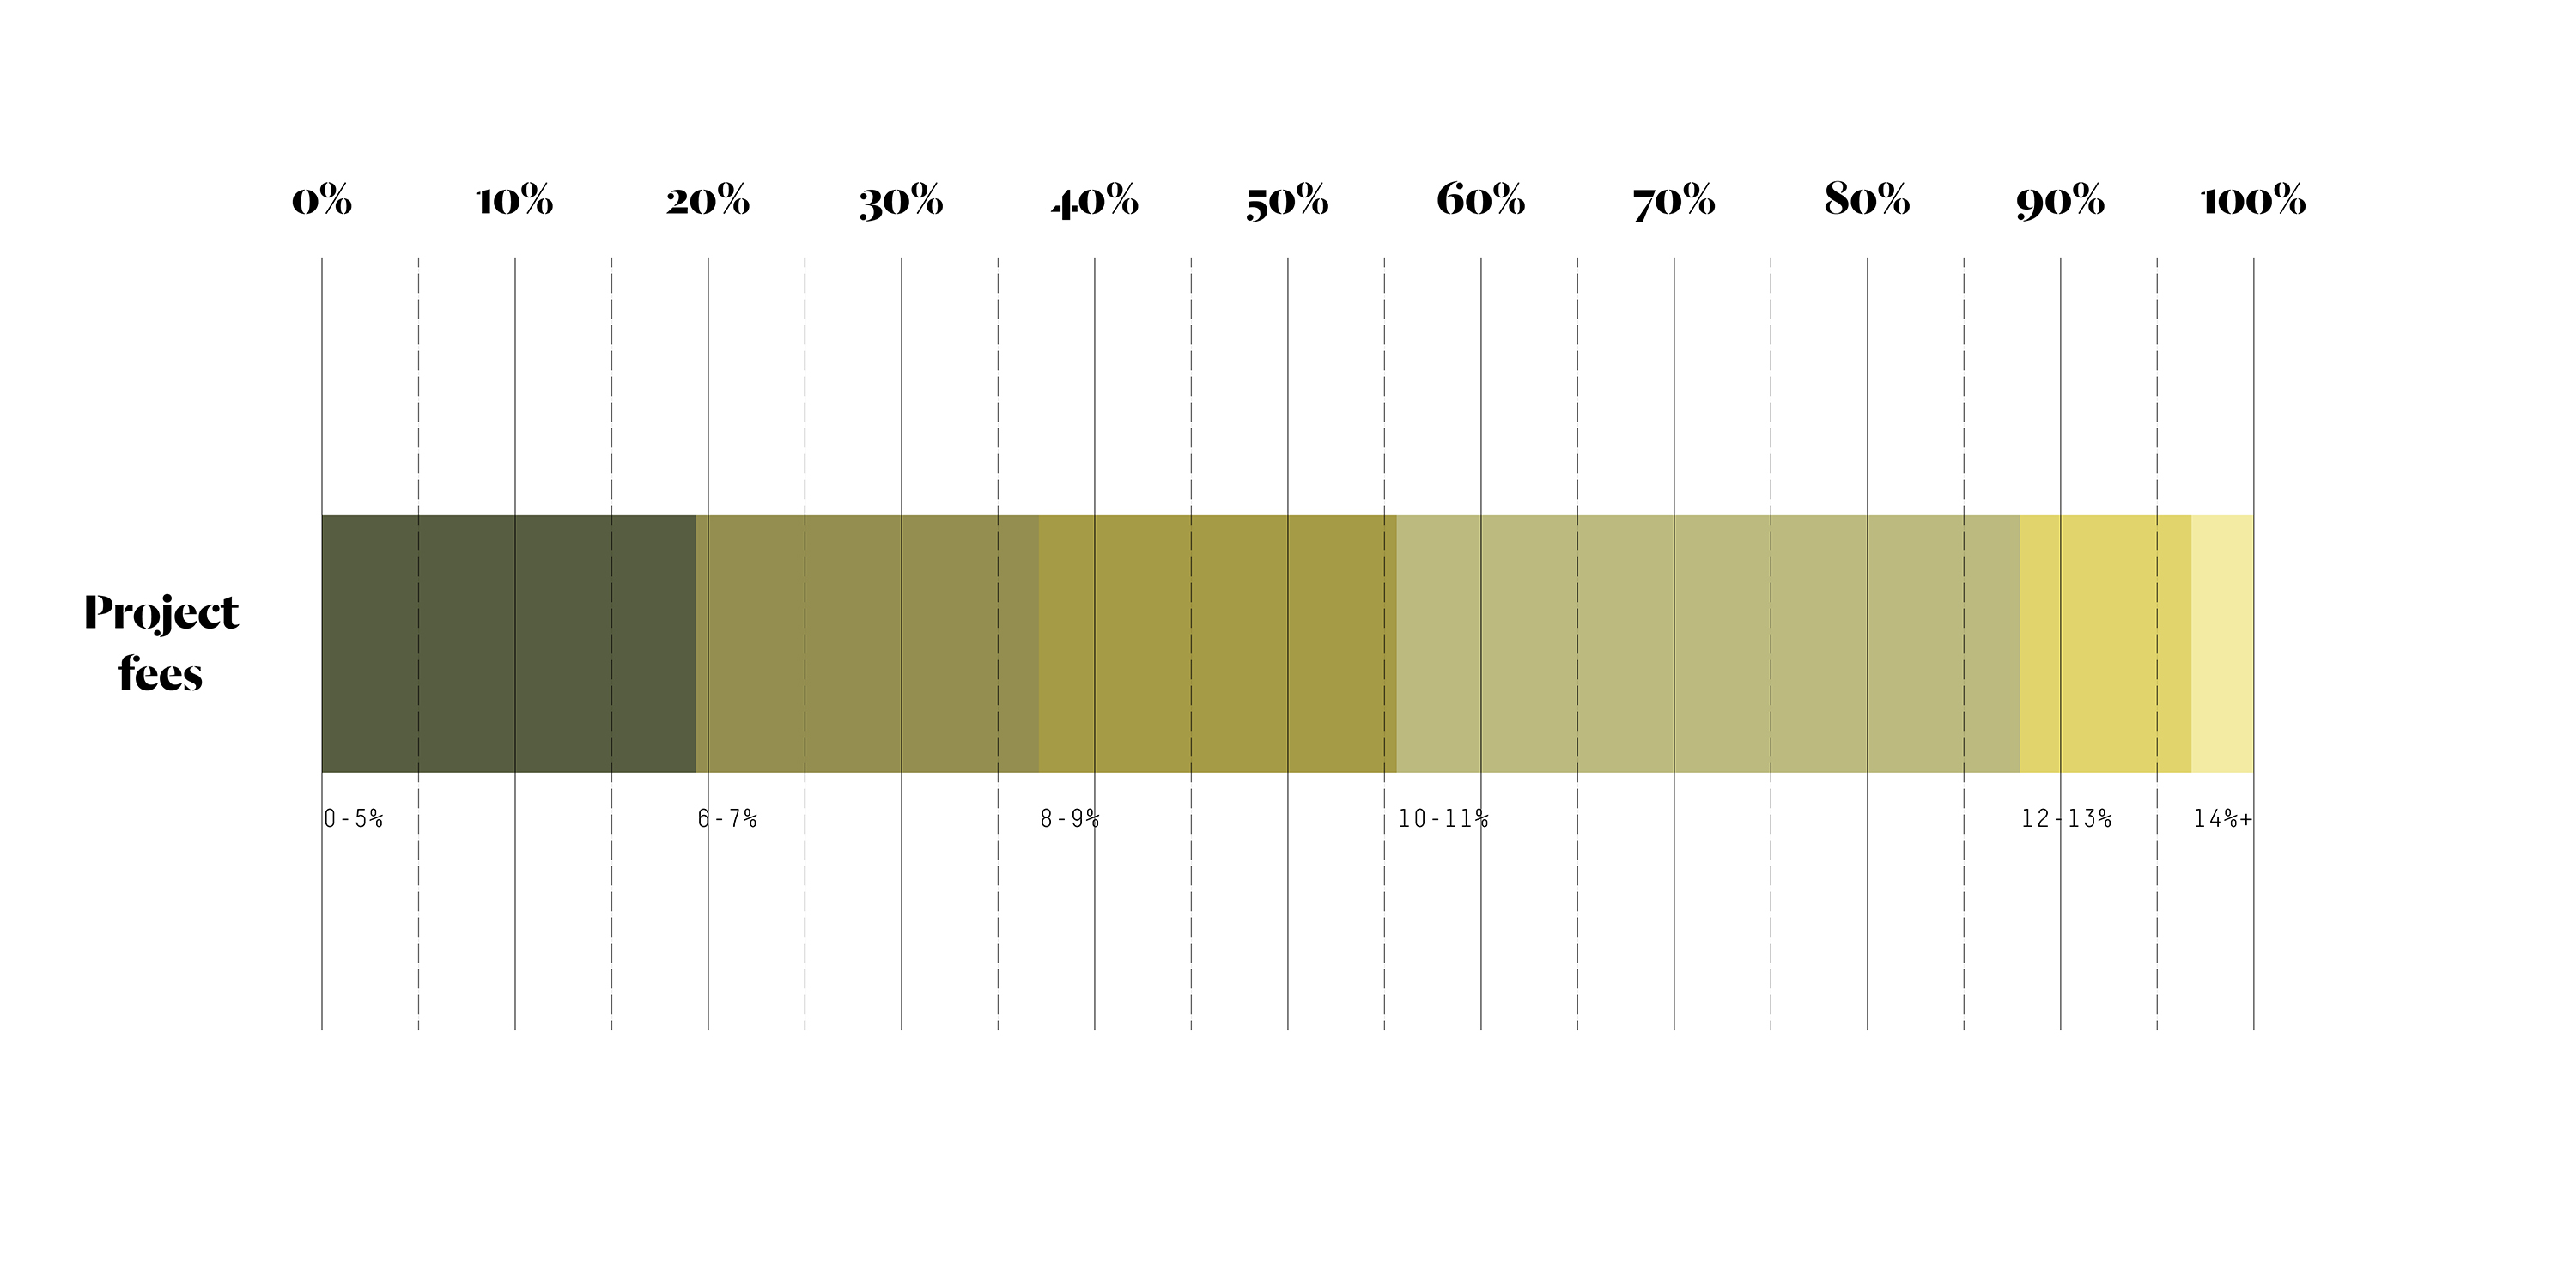
What does this tell us?
- The average fee for a $1,000,000 house is 8.7% or $87,000.
- The median fee is 9% or $90,000.
- The most common fee charged is 10% or $100,000.
And the hours you typically spend on the same project:
What does this tell us?
- The average number of hours spent on a $1,000,000 house is 650.
- The maximum number of hours is 2,490.
- The least time consuming phases are pre-design and tendering.
- The most time consuming phases are contract documentation and contract administration.
And that’s it for now.
Once again, a big thank you to all of the ArchiTeam members who generously provided your time contributing to our survey, it is immensely valuable. Stay tuned for the next article in the series, which will examine some of the data gathered in response to the second part of the member survey, what do you think of the future?
Footnotes:
- So much of the advocacy work we do in ArchiTeam and throughout the profession, we do with one hand tied behind our back. It’s all well and good to trumpet the quality of our design work, but while we cover each other in glittering awards, the true rivers of power within the built environment shift ever further away from us. I contend that quantifying the economic output of the profession is the best possible way to reverse this trend. Knowing how much we collectively contribute is the first step to ensuring future generations of architects can continue to do so.
- ArchiTeam currently has 721 individual members spread across 585 architecture practices.
- Key economic indicators, summary; Australian Bureau of Statistics; accessed June 2019.
- Population clock; Australian Bureau of Statistics; accessed June 2019.
- To avoid the amusing confusion at Making a Living, revenue = total fees, not take home salary!
- The vertical legends are missing from these infographs as they’re just confusing. Next survey, we’ll re-ask team size questions based on full time equivalent numbers and will get much more valuable data in return.
Image sources:
- ArchiTeam logo, copyright ArchiTeam.
- Project types. Data sourced from the 2018 ArchiTeam member survey, visualisation by the author.
- Project volume and budgets. Data sourced from the 2018 ArchiTeam member survey, visualisation by the author.
- Fee setting and revenue. Data sourced from the 2018 ArchiTeam member survey, visualisation by the author.
- Revenue and team size. Data sourced from the 2018 ArchiTeam member survey, visualisation by the author.
- Project fees. Data sourced from the 2018 ArchiTeam member survey, visualisation by the author.
- Project time. Data sourced from the 2018 ArchiTeam member survey, visualisation by the author.